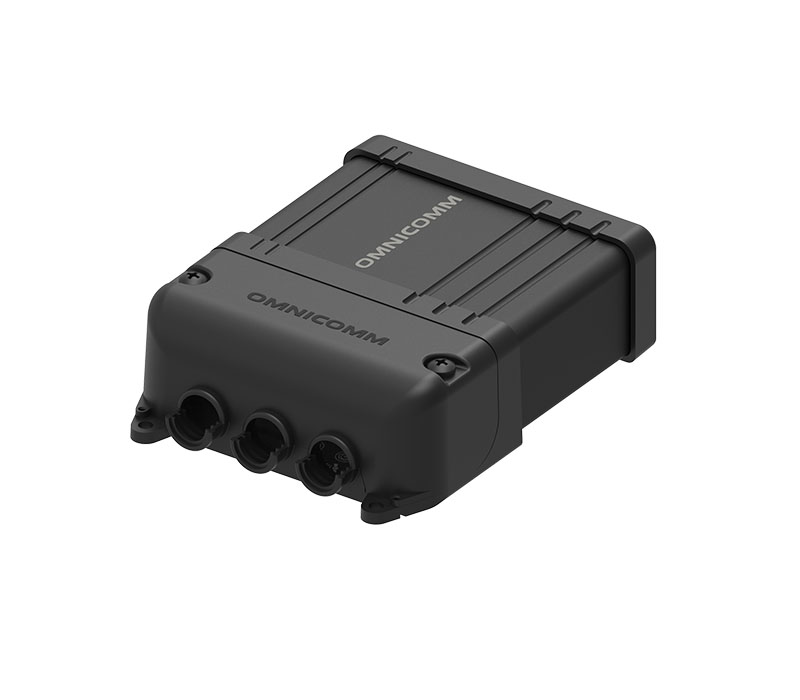
Fleet speed management with Omnicomm records every speeding event, harsh acceleration and braking, and high-RPM operation — right next to the fuel your vehicles actually burn.
Higher accident risk and traffic fines.
Aggressive acceleration and braking waste fuel and wear parts.
Extra engine load, fuel use and wear.
Violations on the road and inside geofences.
Aggressive manoeuvres, harsh acceleration and braking.
RPM levels read from the CAN bus.
Usage read from the CAN bus.
Dispatchers are notified of violations.
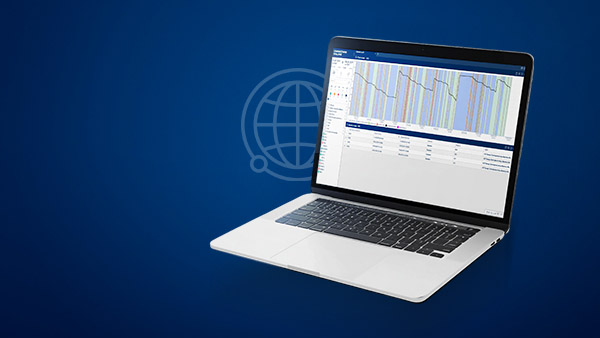
Speed and fuel volume on one timeline.

Records speed, acceleration and braking, plus CAN data.

Every violation with time and place.

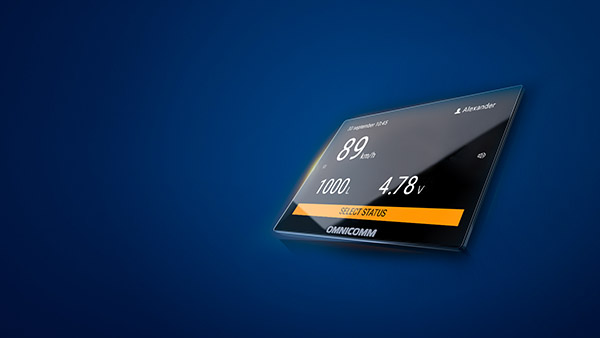
Drivers see speed and fuel data in the cab.
Ranks drivers and finds repeat violations.
average fuel savings, truck speed brought to legal limits · PZC Varaždin
fleet-wide fuel savings and fewer speeding fines · Belgrade
to ROI, fewer speeding events and less idling · ABInBev Africa
fuel economy with speed and idle-time analytics · Fides Mining
Tell us your fleet size and fuel spend — we will show where speed and driving style burn fuel.
| GPS tracker only | Tracker + CAN + fuel sensor | |
|---|---|---|
| Speed and speeding events | ✓ | ✓ |
| Harsh acceleration and braking | ✓ | ✓ |
| Engine RPM and cruise control | ✕ | ✓ |
| Fuel actually burned | ✕ | ✓ |
| Fuel drains and refuelling | ✕ | ✓ |
Fleet speed management is the control of how fast — and how smoothly — company vehicles are driven. A speed management system records speed against the limits set for each road or zone, detects harsh acceleration and braking, and reads engine RPM from the CAN bus, so managers see not only who broke a limit but how the whole fleet drives.
Omnicomm Online compares vehicle speed with the limits you set, including separate limits inside geofenced areas such as quarries, depots or landfill zones (see geofencing control). Every violation is logged with time and place, dispatchers get instant notifications, and the Violations report collects all events for a period so recurring problems are easy to spot. The Track report shows where on the route it happened.
Aggressive manoeuvres, harsh acceleration and braking, and prolonged high-RPM operation raise operating costs, accident risk and wear. Omnicomm GPS trackers record acceleration and braking; connected to the CAN bus, they also report engine RPM, cruise control use and other parameters that affect safety and fuel efficiency. The Safe Driving module adds driver ranking and detection of recurring violations.
Driving style shows up directly in the fuel bill. With Omnicomm fuel level sensors, speed and RPM data sit next to the actual fuel consumption of each vehicle, so the effect of coaching is measurable — see fuel consumption control. PZC Varaždin in Croatia brought average truck speed down to legal limits and achieved 20% average fuel cost savings; a 500-vehicle municipal fleet in Belgrade reported fewer speeding fines alongside 20–30% fleet-wide fuel savings.
Speed data is most useful when it is tied to a person. Driver control adds RFID driver identification and driver rating, and the ICON display gives drivers real-time feedback on speed and fuel consumption in the cab.
Omnicomm Online ships with 50+ fuel and fleet analytics reports out of the box, covering consumption versus quotas, fill and drain events, driver behavior scoring, idle time, geofence breaches, maintenance schedules, and CO2 emissions. The platform tracks 150+ parameters per vehicle or asset and supports email and SMS alerts. Reports export to PDF and Excel, or pull into a BI dashboard via REST API.
The report library is organized by the three pillars of fuel efficiency. Fuel Operations reports cover loads (refueling events), drainings (unauthorized fuel removal), dispenses (fuel given to vehicles from depot tankers), and reconciliation between dispensed and received volumes. Fuel Consumption reports cover total consumption, actual L per 100 km for vehicles, actual L per hour for heavy machinery, quota comparison versus norms, and idle time waste. Fuel Usage reports cover consumption with auxiliary equipment on or off (PTO, refrigeration units), consumption inside or outside geofences, and consumption during specific route segments. On top of the standard library, partners can build custom reports using the report builder, and Enterprise Server customers can commission fully bespoke analytics. ESG reports include the standard scope 1 emissions calculation directly from fuel data, exportable in formats compatible with CSRD, SBTi, CDP, and GHG Protocol disclosures.
Fleets typically reduce fuel costs by 25-35% within the first months, and up to 50% in some industries. Documented results include 45% fuel economy at Fides Mining (Brazil), 32% savings at SBI International (Tanzania), 24% at ARSS Infrastructure in India (equal to $130,000 in monthly savings), and 12% in the first month at NQC Mexico (a $10,000 monthly saving with payback in under 3 months).
Savings stack on top of each other and the mix depends on how the fleet currently leaks fuel. Theft and fraud prevention is the largest one-time gain in month one after install: Belgrade Municipal's 500-vehicle fleet cut fuel consumption 15 to 40 percent within two months, with theft prevention as the dominant driver in the first weeks. Idle-time reduction comes next, as the platform surfaces vehicles burning fuel while parked and managers retrain the drivers responsible. Route and consumption optimization adds another layer by comparing each driver's L per 100 km against fleet norms and flagging the outliers. Maintenance-driven savings round out the picture, since catching engine inefficiencies early prevents fuel-burn drift. To estimate your own savings, take your current monthly fuel spend, run a conservative 15 percent reduction (idle and consumption alone) and a realistic 30 percent (theft prevention included), and compare against the system cost over 12 months. Most fleets break even well before year-end.
Yes. A unified vehicle tracking and fuel monitoring system pairs a GPS tracker (capturing location, speed, ignition, and driver behavior) with a connected LLS fuel sensor (capturing the in-tank fuel level), with both data streams flowing into one software platform. OMNICOMM LLS sensors plug into any tracker that supports the LLS protocol, which is virtually every modern fleet telematics terminal, so the combined platform can be built on the OMNICOMM stack or on the buyer's existing telematics provider.
Running tracking and fuel monitoring as separate platforms is the most common operational pain point fleets bring to OMNICOMM. Two platforms means two licenses, two dashboards, two sets of alerts, and constant data reconciliation between systems whose timestamps and vehicle IDs often disagree. A unified architecture eliminates that overhead. A single login shows real-time vehicle position on the map with fuel level overlaid, every refuel event is geo-tagged to the station where it happened, and every drain event is tagged to the location and driver responsible. Reports combine route, speed, idle time, fuel consumption, and theft alerts in one view. For fleets already running a third-party tracking platform they want to keep, OMNICOMM LLS sensors integrate directly via the LLS protocol so fuel data feeds into the existing telematics platform without forcing a switch. White-label partners often deliver the combined platform under their own brand.
CAN bus data is generally not accurate enough for fleet fuel monitoring. The vehicle's CAN bus reports the factory dashboard gauge, which is typically a float-type sensor with up to 20% error and an upper dead zone that hides refueling events. CAN data can show approximate fuel level for the driver but cannot reliably detect refuelings, drains, or consumption anomalies, which are the events that drive ROI for a fleet.
Many fleet operators consider CAN bus as a no-extra-hardware option because GPS trackers can read it directly, so the appeal is clear. The trade-off is data quality. The factory fuel gauge inside almost every commercial vehicle uses a float-type sensor connected to the dashboard via the CAN bus. Float sensors have moving parts, blind spots at the top and bottom of the tank, and inherent measurement noise. The signal that reaches the CAN bus is filtered and smoothed by the vehicle's ECU specifically for human-readable display, not for analytics. Real refueling events of 20 to 50 liters often don't register cleanly because the upper dead zone hides them, and gradual drains are invisible. For fleets serious about detecting theft, idle waste, and consumption patterns, an aftermarket capacitive sensor such as OMNICOMM LLS is required. The capacitive sensor sees actual fuel level with sub-0.5% error and reports clean event data that CAN bus cannot produce.
We use cookies for analytics and advertising. They are set only with your consent. Privacy policy